I'm back!
After a long beak I've decided to start up my blog again, but this time with a difference. I'm trading full-time nowadays and let me tell you it can be a bit of a lonely affair. So to relieve the boredom (never thought I say that about making money!) I've decided I'll make regular postings about what I'm up to.
I intend to make live calls and make a record of my positions. You'll be able to look over my shoulder and track eaxctly how well I'm doing for yourself. Oh and a long the journey I'll give you insights into just why I make the trades so like a realtime mentor if you like.
Please feel free to post any comments, questions and suggestions.
Until Monday ....
Saturday, September 01, 2007
Tuesday, August 29, 2006
Start Making Serious Money In The Forex Market This Year
by John Anghelache
Easy-Forex? The best trading platform available today.
ForexProfiteer.com - Learn to trade the Forex with our Simple Day trading strategy.
The forex market is the largest in the world.
About $1.5 Trillion dollars flow through it daily. Finally, the forex is open to all of us. For decades only banks, investment firms and super-wealthy individuals had access to the forex.
Making money in the forex is a matter of having accurate information and using it properly.
But where do you turn to if you're new to currency investing?
Here are a couple of options:
1. Find a mentor.
Start talking to investors in the market and find someone you hit it off with who is doing well trading currencies.
Ask them for their advice about what books to read, programs to buy and strategies to consider.
Most successful investors - once you build a relationship with them - are more than willing to "show off" and spill the beans a little.
2. Read top-selling books on forex trading.
One outstanding characterisitc successful investors have is they never stop learning.
Reading best sellers on forex gives you an continual supply of cutting-edge information. A lot of times just one simple idea can result in windfall profits for you.
3. Invest in one forex trading program per quarter.
Nothing will short cut the learning curve like having a proven strategy. Do a little research and find out what the most recommended programs are.
Then invest in one program every three months for one year. At the end of the year you will have four proven strategies for trading forex.
Keep this in mind...
The ultimate success formula is to find someone who is already getting the results you want... model what they do... and monitor your results.
When you combine the three pieces of advice above you give yourself the greatest edge.
Before you know it you'll be trading like an expert.
Now, go get 'em and start making serious money in the forex market this year. You can do it.
John Anghelache is a consumer advocate for currency investors. Find out how to avoid losing your shirt in the forex market at www.forexscamsexposed.com
Easy-Forex? The best trading platform available today.
ForexProfiteer.com - Learn to trade the Forex with our Simple Day trading strategy.
Forex Charts Explained !
The forex charts that you’ll be using for your trading, depending on the forex system that you’re using, may be either line charts, OHLC charts, and probably most commonly, Japanese candlestick charts.
Easy-Forex? The best trading platform available today.
ForexProfiteer.com - Learn to trade the Forex with our Simple Day trading strategy.
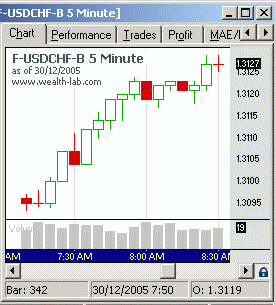
Remember that any currency pair is always quoted in the same order. For example, the USDCHF is always quoted as the USDCHF, with the USD being the base currency and CHF being the terms currency, and not the other way around.
So on a chart of the USDCHF, when you see on a chart that the current 1 minute candle is fluctuating around 1.3127, this means that 1 USD is equivalent to around 1.3127 Swiss Francs:

Note that more than one time frame may be used in combination when trading a forex system. For example, you many need to use a 4 hour chart, a 1 hour chart and a 5 minute chart. Many systems will use multiple time frames to confirm a trend as a part of the set up for a trade.
Let’s have a further look now on how to read forex charts...
How to Read Forex Charts
Especially if you’re new to forex trading, you’ll need to know some more detail about reading forex charts.
Now we've seen an uptrending chart of CHF already, so let's have a look at a downtrending chart of GBP as our example now:
Note these 5 points about how to read these typical forex charts:
1
Realise that if you go long (that is, buy) the currency pair, that the trade will go in your direction if the chart goes up, that is the base currency is strengthening against the terms currency.
On the other hand, if you short (that is, sell) the currency pair, then you’ll want the currency price to go fall, that is, for the chart to trend down, for the trade to go in your direction.
2
Have a look at the time frame displayed. In this example, it is a 5 minute chart of the USDCHF. Some of your trading systems will look at a few times frames, not just one. For example, you may need to look at the daily, 4 hour, 1 hour, 5 minute or even 1 minute charts. So make sure that the chart you’re looking at has the right time frame.
3
Realise that for most forex charts that you’ll read, that it is the BID price that is plotted on a OHLC or candlestick chart, rather than the ask price. Take this into account when placing buy orders based on looking at the prices on the chart, because when you buy, you buy at the ask (offer), not the bid.
So when you buy at market, you’re actually buying at the offer which is the chart price plus the spread.
Also keep this in mind when you’re placing stop orders as well, because most platforms will ask whether you want to place stop orders as “stop if bid”, or “stop if offered”. If you place a “stop if bid” order at “x” price, then you’ll get out when the chart price reaches that “x” price, but if this is a “stop if bid” buy order (as a stop loss for a long position), rather than a stop sell order, then the price you actually get out at will be that price plus the spread. Your trading system will have rules for how to place stop orders, that is whether to place buy stop orders as “if bid” or “if offered”.
For example, let’s say that you’re in a short position, and your stop loss is hit when the chart price reaches 1.7260, so you place a “stop if bid” buy order, as your stop loss order. The price you’ll buy at is going to be 1.7260 plus the spread of say 4 pips, which will be 1.7264. This is because when the bid price is 1.7260, the offer price is 1.7264.
On the other hand, if you place a “stop if offered” buy order at 1.7264, then you’ll get out of the trade when the offer is 1.7264. Note that when this occurs, that the price on the chart will be 1.7264 minus the spread, which comes to 1.7260. Just follow whatever convention and routine your system uses. But you should have this concept clear now.
4
Realise that the times on the bottom of the chart will be displayed in the time zone that the forex charting software is set to. Some are set to Greenwich Mean Time (GMT), while others are set to New York time, or other time zones as well.
What this means is that if there’s a major economic announcement that you want to trade, or exit a trade beforehand, that you’ll have to convert the time of the announcement, which may be in GMT for example, to both your time and the chart time, so you know when the announcement is actually going to happen.
5
Fifthly, check to see if the times on the bottom of the chart correspond to when the candle opens, or when the candle closes. On the above charts, the times corresponding to the candles are the times that the candles closed, at GMT time. Different charts are different in this regard, so see if you can find out. This is especially important if you’re trading systems which rely on the precise price action in relation to major economic announcements.
Easy-Forex? The best trading platform available today.
ForexProfiteer.com - Learn to trade the Forex with our Simple Day trading strategy.
Daily Forex Outlook - Tues 29th Aug 06
U.S. Dollar Trading edged slightly lower against the majors
Tue, 29 Aug 2006 02:47:33 GMT
by Easy Forex Team
by Easy Forex Team
CURRENCY TRADING SUMMARY
- U.S. Dollar Trading (USD) edged slightly lower against the majors in the overnight forex session as the market awaits the FOMC minutes from the August 8th meeting to better gauge the interest rate policy going forward. In other markets, the Dow Jones index rose by 68pts while the NASDAQ rose by 20pts as a falling oil price lowered fears of high inflation. Crude oil fell by US$1.90 to US$70.61 a barrel as tropical storm Ernesto lost intensity and veered away from important oil rig installations in the Gulf of Mexico. Looking ahead, consumer confidence is due out today together with the FOMC minutes of the August 8th Federal Reserve meeting.
- The Euro (EUR) traded within a low of 1.2756 and a high of 1.2821, before closing at 1.2779 in the New York session. On the data front, M3 money supply came in less than expected at 7.8% compared to an 8.3% estimate.
- The Japanese Yen (JPY) traded within a low of 116.87 and a high of 117.33 versus the dollar, before closing at 117.22 in the New York session. On the data front, the unemployment rate came in as expected at 4.1%, and household spending came in a little worse than expected at -1.3% from a -0.8% expectation but none the less better than the previous result of -2.2%. Looking ahead, Retail sales are due out tomorrow.
- The Sterling (GBP) traded within a low of 1.8863 and a high of 1.8991, before closing at 1.8935 in the New York session. Looking ahead, mortgage approvals are due out tomorrow.
- The Australian Dollar (AUD) traded within a low of 0.7570 and a high of 0.7600, before closing at 0.7585 in the New York session. Looking ahead, retails sales are due out tomorrow.
- Gold (XAU) fell by US$6.90 to US$614.80 an ounce in response to weaker oil prices.
TECHNICAL COMMENTARY

- Euro 1.2790
Initial support at 1.2723 (Aug 25 low) followed by 1.2695 (Aug 15 low). Initial resistance is now located at 1.2854 (Aug 23 high) followed by 1.2941 (Aug 21 high).
- Yen 117.20
Initial support is located at 116.42 (Aug 25 low) followed by 116.09 (Aug 23 low). Initial resistance is now at 117.87 (July 19 high) followed by 118.22 (Apr 18 high).
- Pound 1.8950
Initial support at 1.883 (Aug 25 low) followed by 1.8775 (Aug 18 low). Initial resistance is now at 1.8999 (Aug 21 high) followed by 1.9026 (Aug 16 high).
- Australian Dollar 0.7590
Initial support at 0.7546 (38.2% retracement of the 0.7269 to 0.7717 advance) followed by 0.7489 (Jul 20 low). Initial resistance is now at 0.7673 (Aug 23 high) followed by 0.7702 (Aug 16 high).
- Gold 615
Initial support at 613.14 (Aug 28 low) followed by 607.67 (Aug 18 low). Initial resistance is now at 630.5 (Aug 23 high) followed by 633.1 (Aug 14 high).
Published on Tue, 29 Aug 2006 02:47:33 GMT
Archive
- U.S. Dollar Trading edged slightly lower against the majors
Published On Tue, 29 Aug 2006 02:47:33 GMT - U.S. Dollar Trading edged higher against the majors
Published On Mon, 28 Aug 2006 01:47:16 GMT - U.S. Dollar Trading gained against the majors
Published On Fri, 25 Aug 2006 02:31:42 GMT - U.S. Dollar Trading strengthened slightly against the majors
Published On Thu, 24 Aug 2006 02:10:06 GMT - U.S. Dollar Trading rose against the majors currencies
Published On Tue, 22 Aug 2006 03:08:38 GMT [ View All ]
Easy Forex
P.O. Box 53742. Limassol 3317
http://www.easy-forex.com
info@easy-forex.com![]()
Easy-Forex? The best trading platform available today.
ForexProfiteer.com - Learn to trade the Forex with our Simple Day trading strategy.
Thursday, August 24, 2006
Daily Forex Tips
EUR/USD
EUR/USD Current spot rate: 1.2778, Pivot: 1.2804Today trading range: 1.2700 - 1.2845
Resistance: 1.2795 , 1.2845 , 1.2900
Support: 1.2760 , 1.2735 , 1.2700
Advice: There are news from EU and US today, but we expect bearish movements to continue this week, so maybe we'll see break of 1.2760. We sell at current price 1.2778 with 1.2700 target and stop above 1.2815. Good luck.
Easy-Forex? The best trading platform available today.
ForexProfiteer.com - Learn to trade the Forex with our Simple Day trading strategy.
Subscribe to:
Comments (Atom)


